Troubleshooting integrations
A quick triage guide for the most common integration failures. Most issues fall into one of four buckets: credentials, network/egress, vendor outage, or webhook configuration.
Test connection fails immediately with 401 / 403
Credentials are wrong or have been rotated on the vendor side. Re-issue from the vendor portal and paste fresh into Integrations → the row's edit menu.
Authentication failures (401 / 403 / 404) are not retried — they're treated as configuration signals, not transient noise. Repeated 401s usually mean credentials are invalid, expired, or scoped incorrectly.
Common causes:
- Autotask — the integration code is wrong, or the API user has been deactivated.
- Datto RMM / Datto EDR — API key has expired. Datto keys are particularly prone to silent expiry; check the Datto admin portal.
- IT Glue — the API key was revoked, or the wrong regional endpoint is set (EU vs. US — see Overview).
- Pax8 — OAuth client secret rotated.
Test connection times out
Usually a network-egress restriction on the vendor side (IP allow-list). Ops AI's outbound IPs are listed in the in-app help — ask Ops AI Support if you need them.
Vendor 5xx errors and timeouts are automatically retried with exponential backoff. A single log line for a terminal 5xx means the retry loop already exhausted — the vendor is genuinely unhealthy, not flaking.
Worked yesterday, broken today
Open Integration Status (/app/integrations/status). The last-check timestamp and most recent error message tell you whether it's:
- A transient outage — try again in a minute.
- An auth expiry (very common with Datto) — re-paste credentials.
- A vendor-side incident — check the vendor's status page.
Status looks stale
There is no automated background probe — the Last verified timestamp only advances when you save credentials or click Test connection. If the stamp looks old, click Test connection from the integration row's menu for a fresh reading.
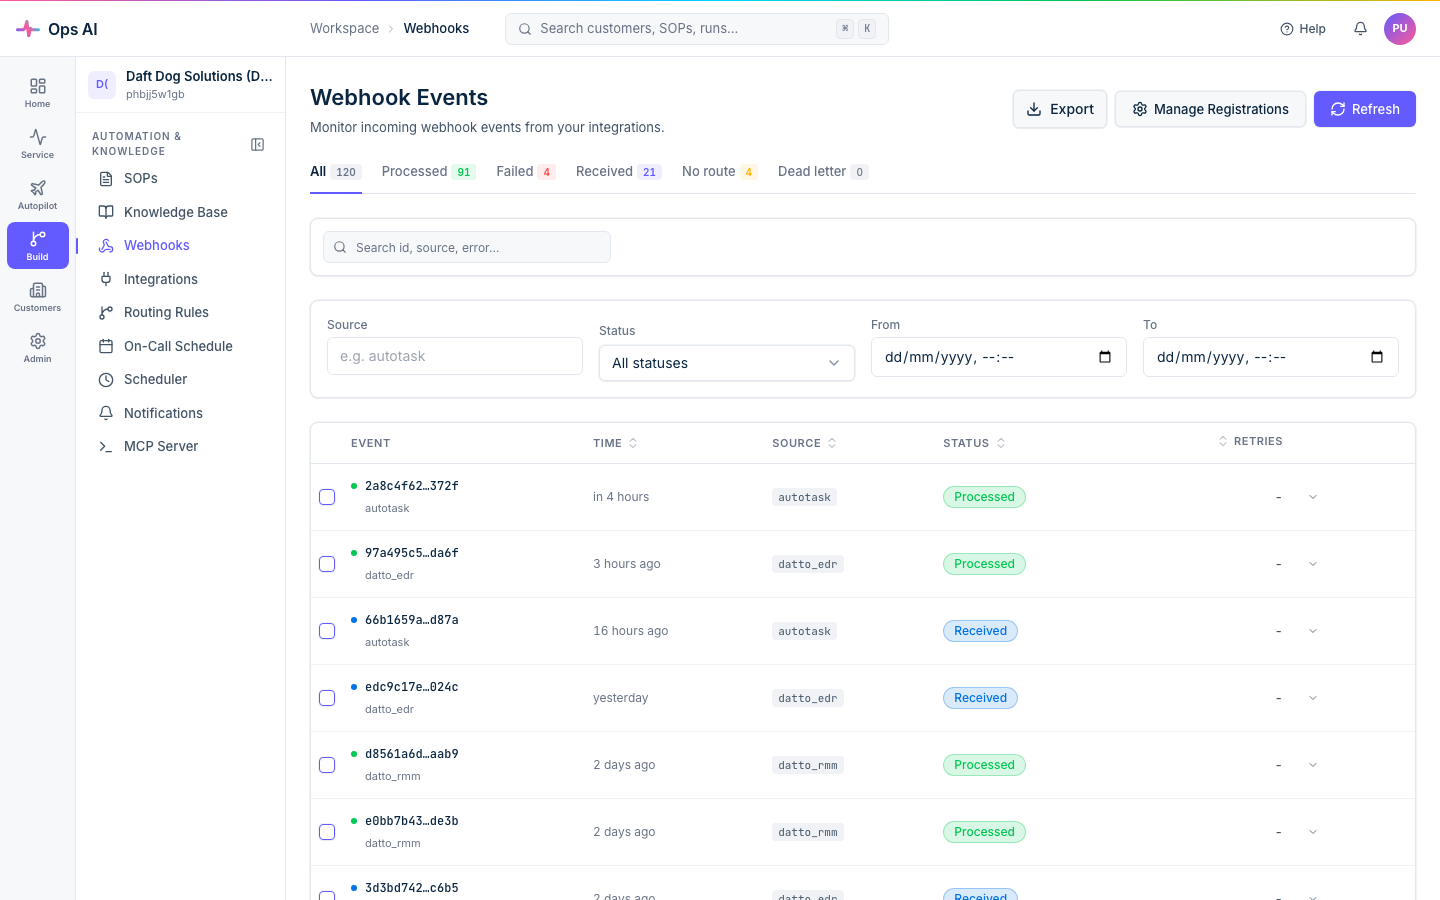
Webhook events failing
The Webhook Events page (/app/webhooks) is the starting point. The tabs across the top split the stream into Processed, Failed, Received, No route, and Dead letter — click Failed to focus on what needs attention.
Expand any failed event for a Failure Analysis panel showing:
- Pipeline stage — colour-coded badge indicating exactly where processing stopped (
validation,sop_matching,agent_dispatch,agent_execution,tool_call). - Error type and message — a short classifier (e.g.
no_sop_matched,tool_execution_error) plus the underlying vendor error. - Suggested fix — a remediation hint (e.g. "Create a SOP with keyword 'disk_full' for source 'autotask'").
- Metadata — stage-specific detail (vendor, tool name, agent run id, closest-matched SOP) in a collapsible JSON viewer.
Apply the suggested fix, then Replay the event to push it through the pipeline again.
Replay guards — what you'll see when a replay is rejected
Replays are subject to four guards to prevent double-mutation:
| Error code | HTTP | Meaning | What to do |
|---|---|---|---|
replay_in_flight | 409 | A replay of this source event is already received or processing. | Wait for the in-flight replay to finish; the response includes conflicting_replay_id. |
replay_cooldown | 429 | You replayed the same source event in the last 5 minutes. | Retry after the cooldown — retry_after_seconds reflects the actual remaining cooldown. |
replay_confirmation_required | 422 | The original event already succeeded. Replaying will re-run agents, re-create tickets, re-send notifications. | If you're sure, pass force=true (single replay) or set "force": true in the bulk replay body. |
replay_rate_limit | 429 | You've exceeded the per-MSP replay rate limit (10 replays/minute). | Wait — the response includes retry_after_seconds. |
Reconcile with vendor
Some vendors (Autotask for webhooks, Microsoft Partner Center for GDAP) offer a Reconcile action on the relevant page. Reconcile is a read-only diff between local state and the vendor's view; it never deletes anything without explicit confirmation, and it never touches resources we didn't create.
Run reconcile periodically (weekly is a good cadence) to catch drift early — for example, a webhook that was deleted manually in Autotask, or a GDAP relationship that was terminated outside Ops AI.
Still stuck?
Contact support@msp-ops.ai with:
- The integration vendor + instance ID (visible on the Integrations page).
- A screenshot of the Integration Status detail or the Failure Analysis panel.
- The timestamp range you're interested in.
Support can look up the correlation ID for any failed call and pivot into vendor logs from there.