Integrations overview
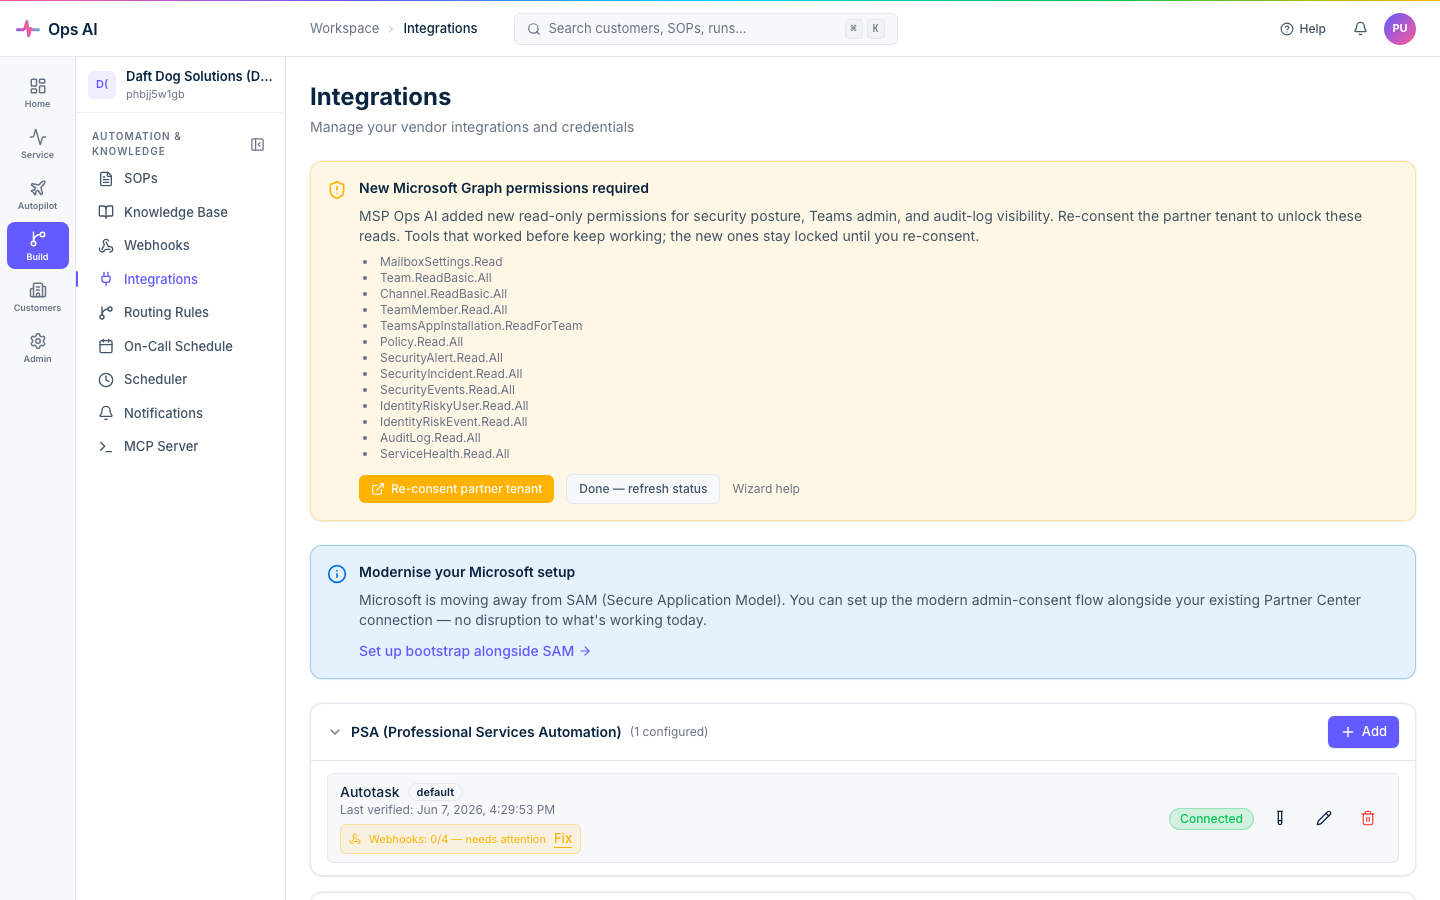
Every useful thing the platform does happens through a vendor integration. Open Integrations (/app/integrations) to manage them.
Supported vendors
Every write below is gated by the write-safety stack — off by default, drafted by the AI, and (for a propose-only customer) approved by a human before it applies.
| Vendor | Type | What we do with it |
|---|---|---|
| Autotask | PSA | Read tickets, companies, resources. Write ticket updates, time entries, notes, tasks, config items. |
| Datto RMM | RMM | Read device inventory, alerts, monitor state. Reboot devices, run scripts/jobs, isolate, mute alerts. |
| Datto EDR | Security | Read incidents, alerts. Isolate/release endpoints, release quarantined files, manage incidents. |
| IT Glue | Documentation | Read docs, configs, contacts, passwords. Gated write, incl. password-vault writes — see per-vendor. |
| Pax8 | Marketplace | Read order history, subscription state. Change subscription quantity, cancel, place orders. |
| UniFi | Networking | Read site / device / client inventory. Reboot devices, manage WLANs/networks, firewall + port-forward rules. |
| Microsoft 365 | Productivity (CSP / GDAP) | Read users, groups, mailboxes, license state. Lifecycle + Intune + Teams write ops via Graph. |
Connecting a vendor
- Click + Add in the appropriate category and choose the vendor.
- Paste credentials. Each vendor needs different fields — Autotask wants username + integration code + secret, Datto RMM wants API key + endpoint, IT Glue wants an API key, etc.
- Click Test connection before saving — we'll hit the vendor's API with your credentials and surface any error verbatim.
- Save. Credentials are encrypted at rest using Fernet symmetric encryption; the encryption key is held in Azure Key Vault separately from the database, and credentials are decrypted only at API-call time.
Each verified instance shows a green Verified badge, the last verification timestamp, and inline edit / delete controls.
Microsoft 365 / CSP doesn't use the same form — it uses the dedicated CSP/GDAP wizard (/app/csp-wizard). See Customers & onboarding.
Vendor-specific notes
IT Glue — EU accounts
IT Glue hosts accounts on two separate servers. If your IT Glue account is on the EU server, you must enter https://api.eu.itglue.com as the API Base URL. If you leave the URL blank, the system will automatically detect the EU endpoint when you click Test connection and advise you to update the URL. US accounts do not need to set a URL.
Default instance
If you have multiple instances of the same vendor type (for example, two Autotask accounts), you can mark one as the default. The default instance is used automatically by agents when no specific instance is specified.
Integration status
The Integration Status page (/app/integrations/status) provides a health dashboard showing the connection status of all your integrations at a glance. Summary cards show how many integrations are connected, disconnected, or need attention. Per-integration rows show:
- Last verified — when the integration was last successfully verified (on save or via Test connection).
- Status badge — green (healthy), amber (warning), red (failing).
- Most recent error — verbatim from the vendor's response, if any.
Verification happens three ways. On save (we run the same test_connection we run for the Test connection button); whenever you click Test connection in the row's edit menu; and on an hourly background health check that automatically re-tests every active integration for your MSP, records the ok / warn / down outcome into the 90-day uptime history, and sends you a notification when an integration first flips to unhealthy. The Last verified timestamp reflects the most recent on-save or manual Test connection — click it whenever you want an on-demand fresh reading; the hourly probe keeps the status badges and uptime strip current in between. A flapping integration tends to indicate vendor-side flakiness rather than anything you've configured.
Separately, every real vendor API call the platform makes is recorded as integration telemetry and rolled up periodically, so the console's Activity view reflects live call volume, latency, and error rates — not just the last verification.
Webhooks
Most PSA / RMM / EDR vendors push real-time events to Ops AI via webhooks. Each registered webhook gets a unique URL and a secret key — copy both and configure the webhook in your vendor's admin panel.
The Webhook Events page logs every received event with source, status, timestamp, and a payload preview. Counters at the top of the page break down the stream into Processed, Failed, Received, No route, and Dead letter buckets so you can spot routing gaps at a glance.
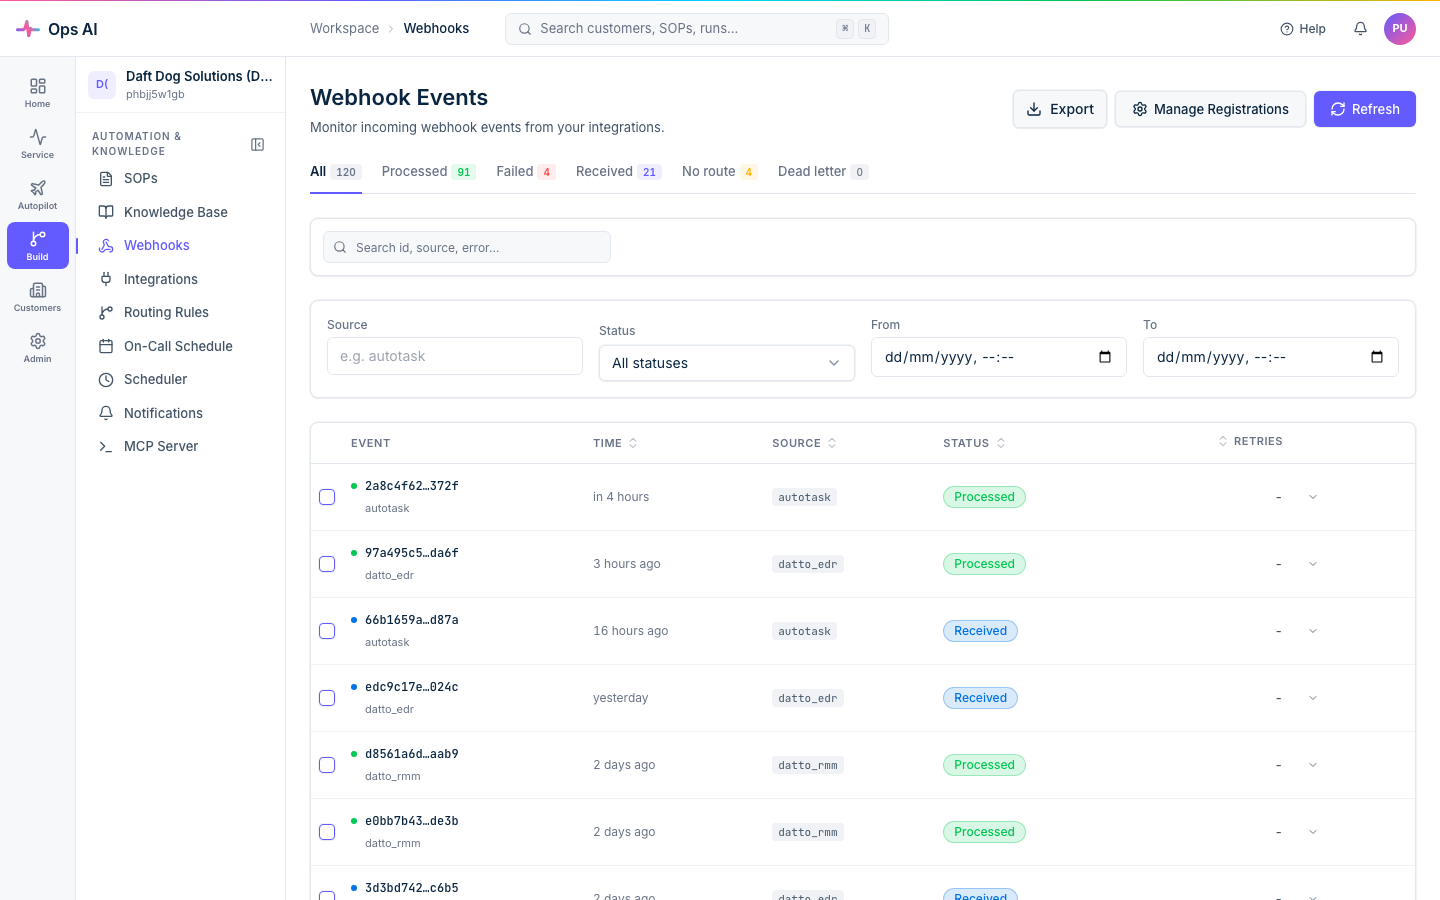
Failed events automatically retry up to 3 times; events that still fail land in the dead-letter queue where you can inspect a Failure Analysis panel showing the exact pipeline stage that broke and a suggested fix.
Replay is a separate action that re-submits an event through the full pipeline as a brand-new event — useful when you've fixed a root cause (missing SOP, rotated credential) and want to push previously-failed events through again.
What's next
If a connection fails or an integration starts misbehaving, head to Troubleshooting.