Audit log & security incidents
This page covers the two surfaces you reach for when "something happened — what was it, who did it, and what should I do about it?" The Audit Log captures every administrative mutation; Security Incidents captures EDR-driven security events the platform has been asked to respond to.
Audit Log — what it is
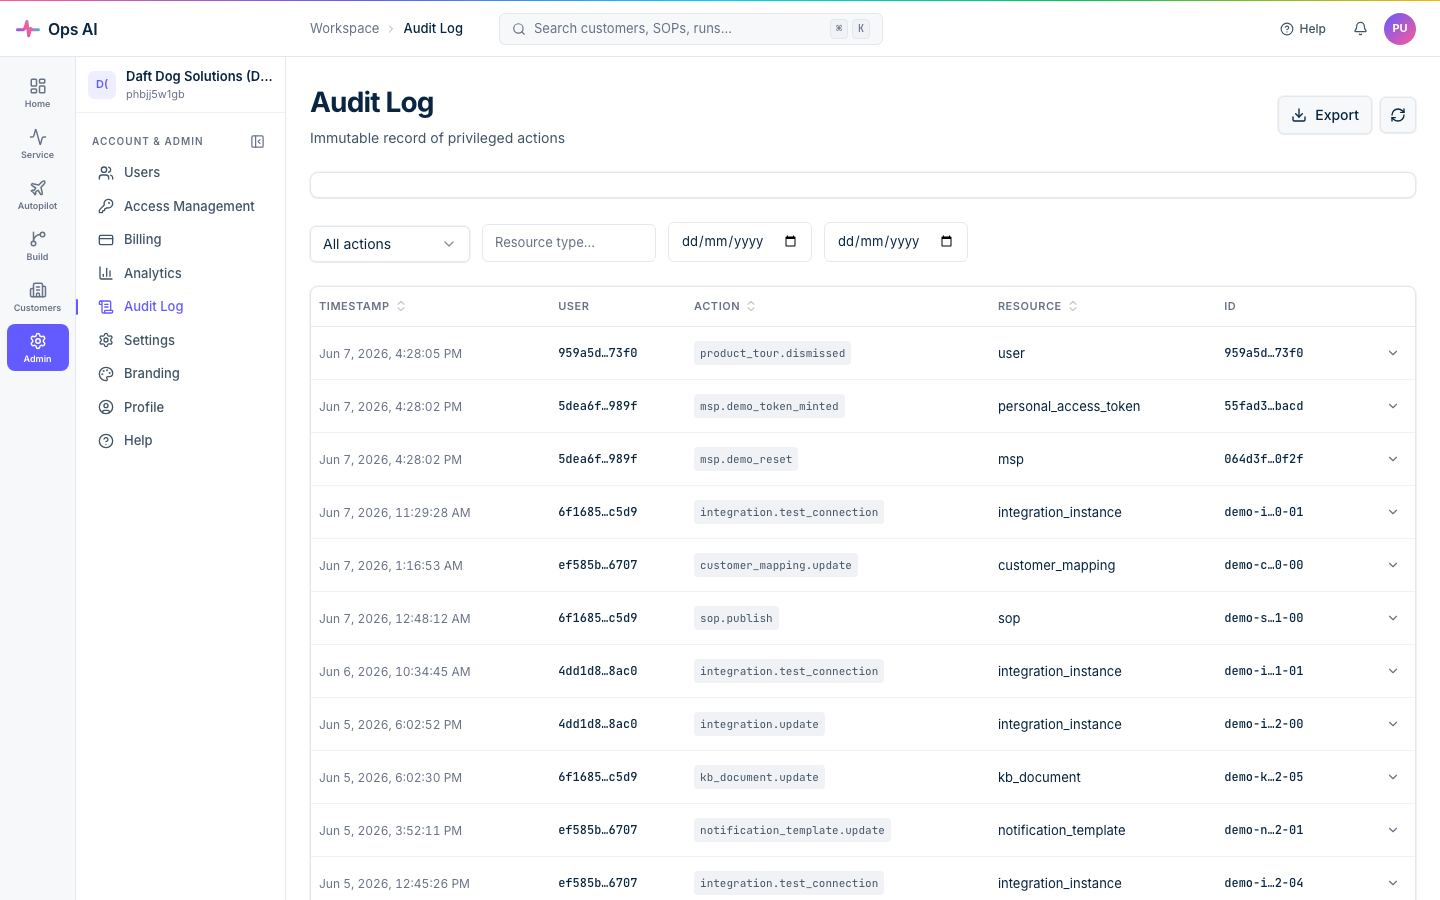
Open Audit Log (/app/audit-log). The Audit Log is a complete trail of every significant action taken in your MSP's tenant — by humans and by agents. It's append-only; entries can never be edited or deleted from the UI.
What gets logged
The audit trail captures:
- Integration changes — instance created, updated, deleted; credential rotated.
- SOP changes — SOP created, updated, deleted; new version saved; approval-level changed.
- Routing rule changes — created, updated, deleted; priority reordered.
- Approval decisions — granted or rejected, with comment.
- CSP/GDAP changes — wizard steps, customer-tenant onboard/off-board, GDAP role assignments.
- Customer mapping — created, deleted, edited.
- Customer changes — customer record created, edited, soft-deleted.
- User changes — role changed, deactivated, reactivated.
- PAT changes — token created, renamed, deactivated, deleted.
- Notification config changes — Teams webhook updated, per-user preferences changed.
- AI config changes — model swapped, threshold raised, agent type disabled.
- Webhook replay — single + bulk replays, including any guards triggered.
This list is enforced by an AST meta-test — every admin mutation endpoint in the codebase is statically checked at CI time to confirm it calls the audit_log() helper. New mutations can't ship without an audit row.
What an audit entry shows
Each entry surfaces:
- Timestamp — UTC, second-precision.
- Actor — who performed the action: a user (with display name + role at the time), an agent run (with run ID), or
systemfor scheduler-driven changes. - Action — the verb:
created,updated,deleted,approved,rejected, etc. - Resource type — what kind of thing was affected:
integration,sop,approval,customer_tenant, etc. - Resource ID — a reference to the specific resource (clickable where the resource still exists).
- Details — click to expand and view a JSON detail payload with stage-specific context (old vs new values for updates, parameters for actions, etc.).
- Correlation ID — links to the request/run that produced the action; useful for tying together a multi-step operation.
Filtering
Use the filters at the top of the page to narrow:
- Action — show only deletions, only approvals, etc.
- Resource type — show only changes to one type (e.g. only SOPs).
- Actor — show actions by a specific user or agent.
- Date range — focus on a specific window.
Export
Click Export for a CSV download of the filtered view. Up to 10,000 rows per export — for larger pulls, narrow the date range and export each segment.
CSV export is the answer for compliance audits and SOC2 evidence — every privileged action is captured, including the actor, the parameters, and the timestamp.
Reading the audit trail
Two common workflows:
- "What happened with X?" — filter by Resource type + Resource ID; you get the full timeline of changes to that single thing.
- "What did Y do today?" — filter by Actor + Date range; you get every action that user/agent took.
For agent actions, the Audit Log entry will reference the agent run ID — click through to Agent Runs for the full transcript including reasoning + tool calls.
Retention
Audit Log entries are retained per the Data Retention scheduler job (default: 1 year). Aggregated counts survive past retention so analytics charts still work; the per-row detail is what's pruned. Adjust retention in the Scheduler config if your compliance regime requires longer.
Security Incidents
Open Security Incidents (/app/security-incidents). This page is gated on having a Datto EDR integration configured — if you don't have EDR connected, the sidebar item doesn't appear.
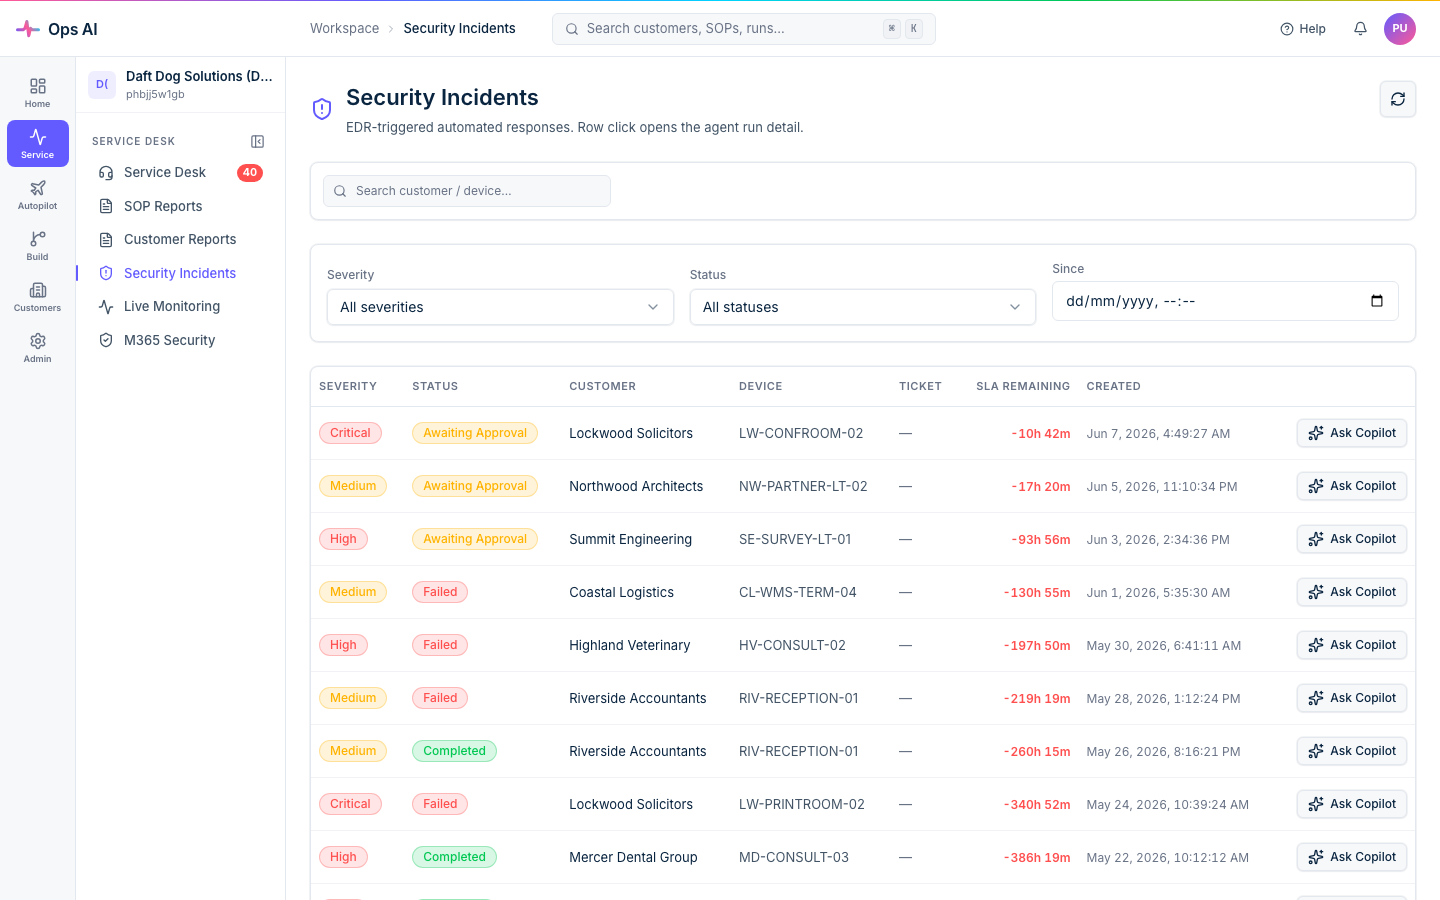
Security Incidents shows the full timeline of EDR-driven security events that have triggered an automated response. Each incident row shows:
- Detected at — when EDR raised the alert.
- Customer — which customer the affected device belongs to.
- Endpoint — hostname / device ID.
- Threat type — malware family, behavioural anomaly, etc.
- Severity — low / medium / high / critical.
- Action taken — isolated, quarantined, ticket-created, awaiting-approval.
- Status — resolved, in-progress, escalated.
Click any row for the full incident detail: agent run timeline, tool calls (isolate, ticket-create, notify), approval history, and any notes from techs who interacted with the incident.
How an incident is created
The flow:
- Datto EDR raises an alert via webhook.
- Routing Rules dispatch the event to the Security Response agent (typically at low priority number, e.g. 5, so it runs before lower-precedence rules).
- The agent decides on a response — typically isolate the endpoint immediately, create a ticket, notify on-call.
- Isolation routes through the Approvals gate by default. Some MSPs configure auto-approval for
severity = criticalto shorten time-to-isolate. - Once the agent finishes, a Security Incident row is created with the full action timeline.
Resolving an incident
The page surfaces the actions you might want to take:
- Re-image device — out of scope; click through to your RMM to action.
- Re-enable endpoint (after isolation) — this is its own approval-gated action; the Security Incident detail page has a Re-enable button when the endpoint is currently isolated.
- Mark resolved — closes the incident in the platform's view; doesn't change the EDR-side state.
- Add note — append to the incident detail, visible to anyone with access to this page.
Notifications
Per-user notification preferences include a Security Threat event type that fires whenever a Security Response agent runs. Most on-call schedules configure this for both Teams and email.
Where to look when something goes wrong
- Audit entry missing for an action you took — the action was either read-only (audit log only captures mutations) or hit the AST meta-test gap (extremely rare; report to Ops AI Support so we can backfill).
- Audit Log too noisy — narrow the filters; the platform records a lot. Exporting the filtered view to CSV usually helps.
- Security Incidents page empty but EDR is integrated — confirm the routing rule for
datto_edrsource maps to Security Response. Without that, EDR events log but no agent runs. - Isolation didn't happen on a critical incident — open the agent run; the timeline shows whether the approval gate was triggered and (if so) who hasn't approved yet. Auto-approval for critical-severity is opt-in via AI Config.
For EDR setup, see Per-vendor integration setup.