Live operations & reporting
This page covers the surfaces you use to watch what's happening and to look back at what happened — a real-time feed (Live Monitoring), the agent-run history (Agent Runs), the SOP-result reports (SOP Reports), per-customer cost rollups (Customer Reports + Customer Analytics), and org-wide trends (Analytics).
Live Monitoring
Open Live Monitoring (/app/live-monitoring) for a real-time event feed. The page uses a WebSocket connection to stream events from the server as they happen — webhooks arriving, agent runs starting/completing/failing, approvals raised/granted/rejected.
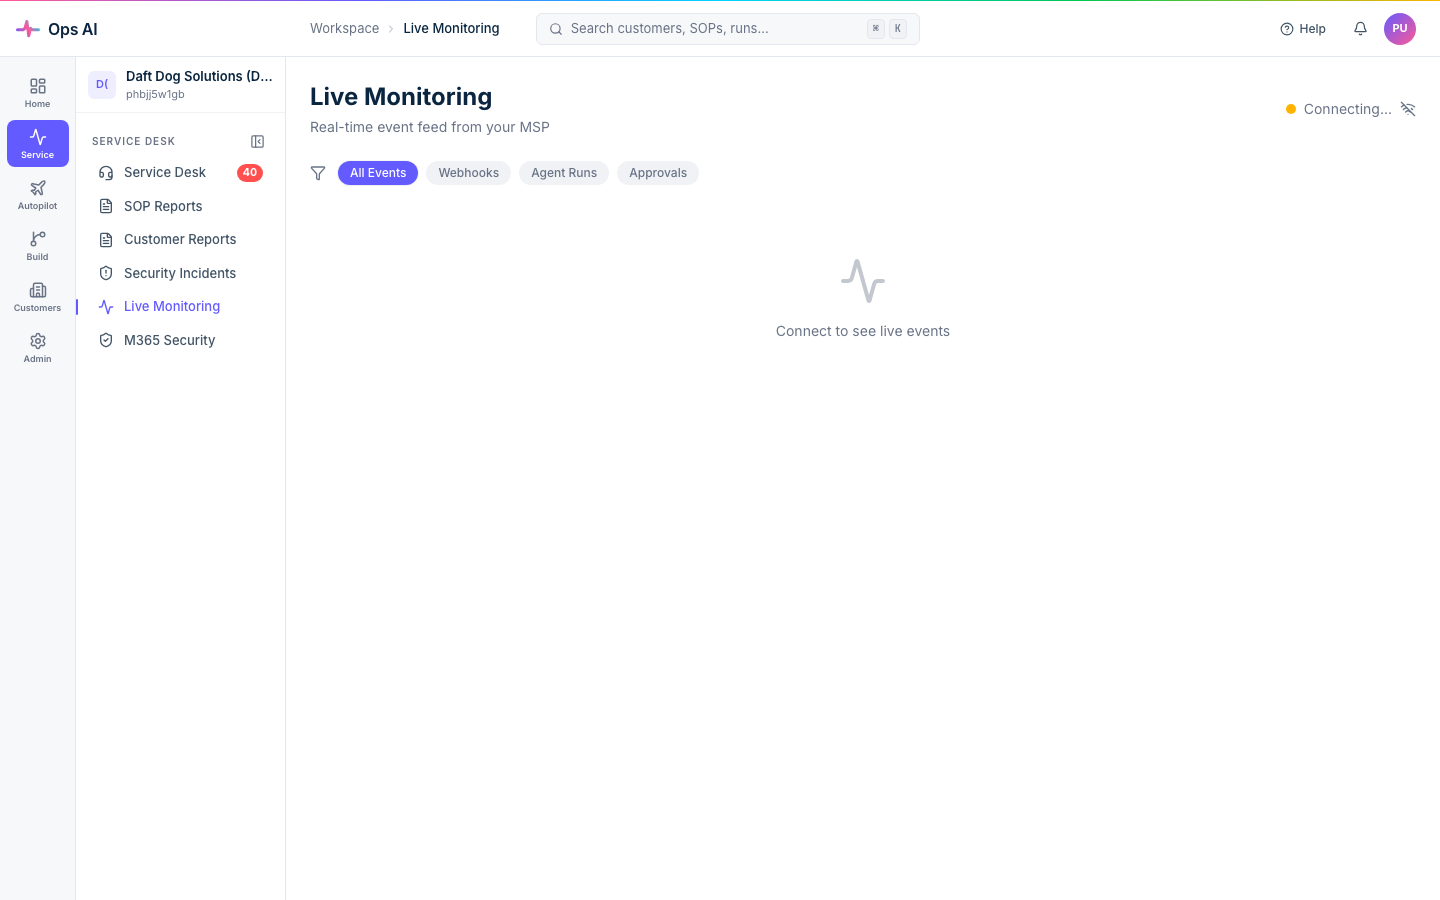
How it works:
- Connection status — a green dot next to the page title means the connection is active. A red dot means the connection is lost; the page will try to reconnect automatically with increasing delays.
- Auto-reconnect — if the connection drops (network hiccup, browser sleep), the page reconnects without intervention.
- Maximum events — the feed shows up to 100 events at a time. As new events arrive, the oldest ones drop off the bottom.
Filter by event type from the dropdown:
- All — every event.
- Webhook — incoming webhook events.
- Agent Run — agent execution events (started, completed, failed).
- Approval — approval requests + decisions.
Important: Live Monitoring is read-only and not persisted. Refreshing the page clears the feed. To review historical events, use Webhook Events, Agent Runs (below), or Audit Log.
Agent Runs
Open Agent Runs (/app/agent-runs) for the historical list of every agent execution. Filter by:
- Agent type — Triage, SOP Execution, Alert Correlation, Security Response, Reporting.
- Status — running, completed, failed, awaiting approval.
- Customer — narrow to a specific customer's runs.
- Date range — focus on a specific window.
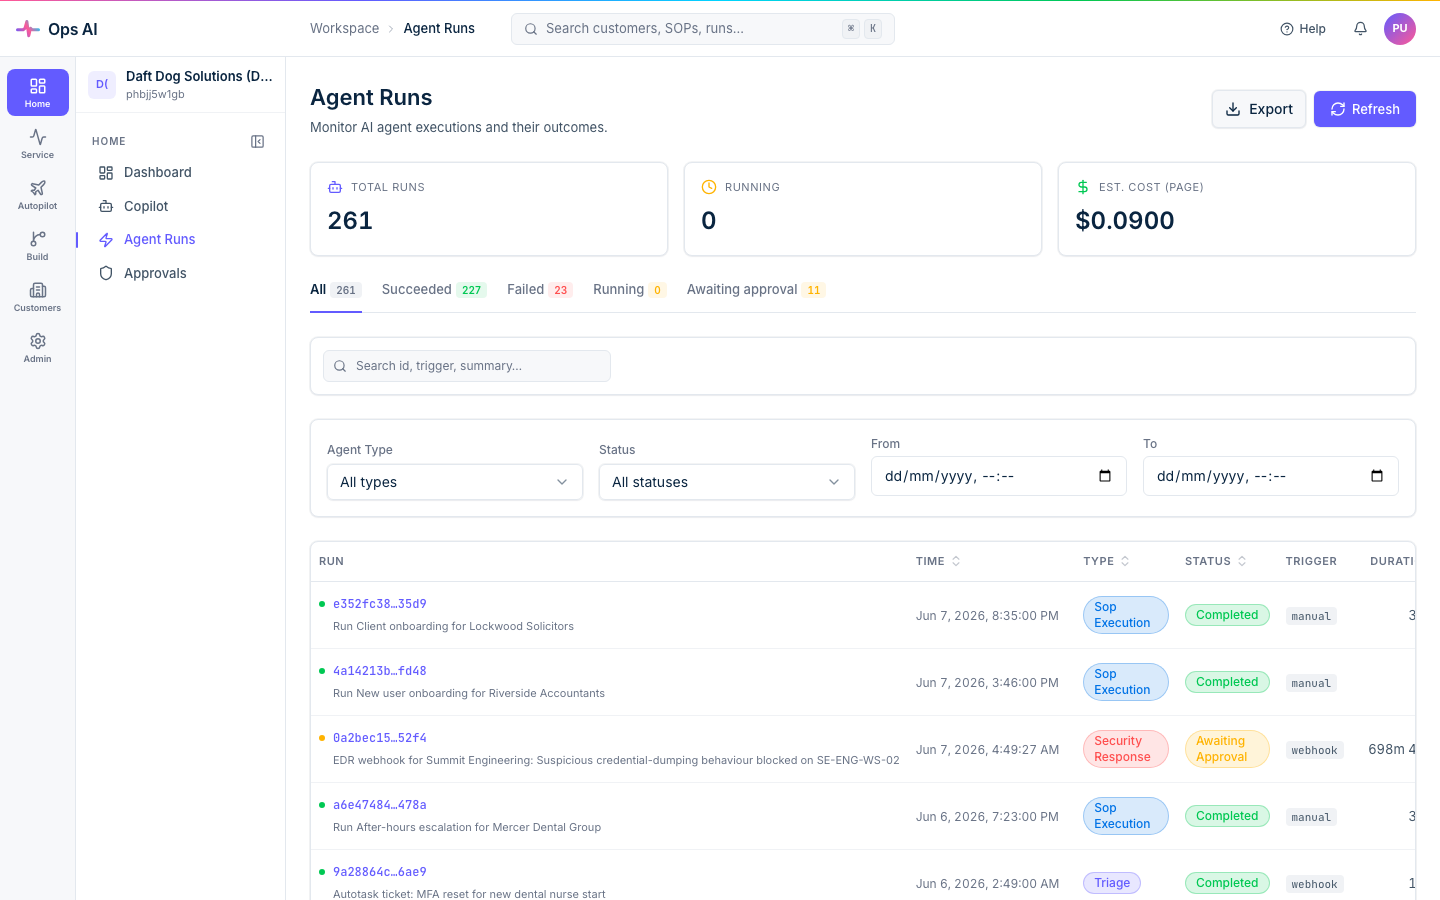
Click any row to open the detail page, which shows:
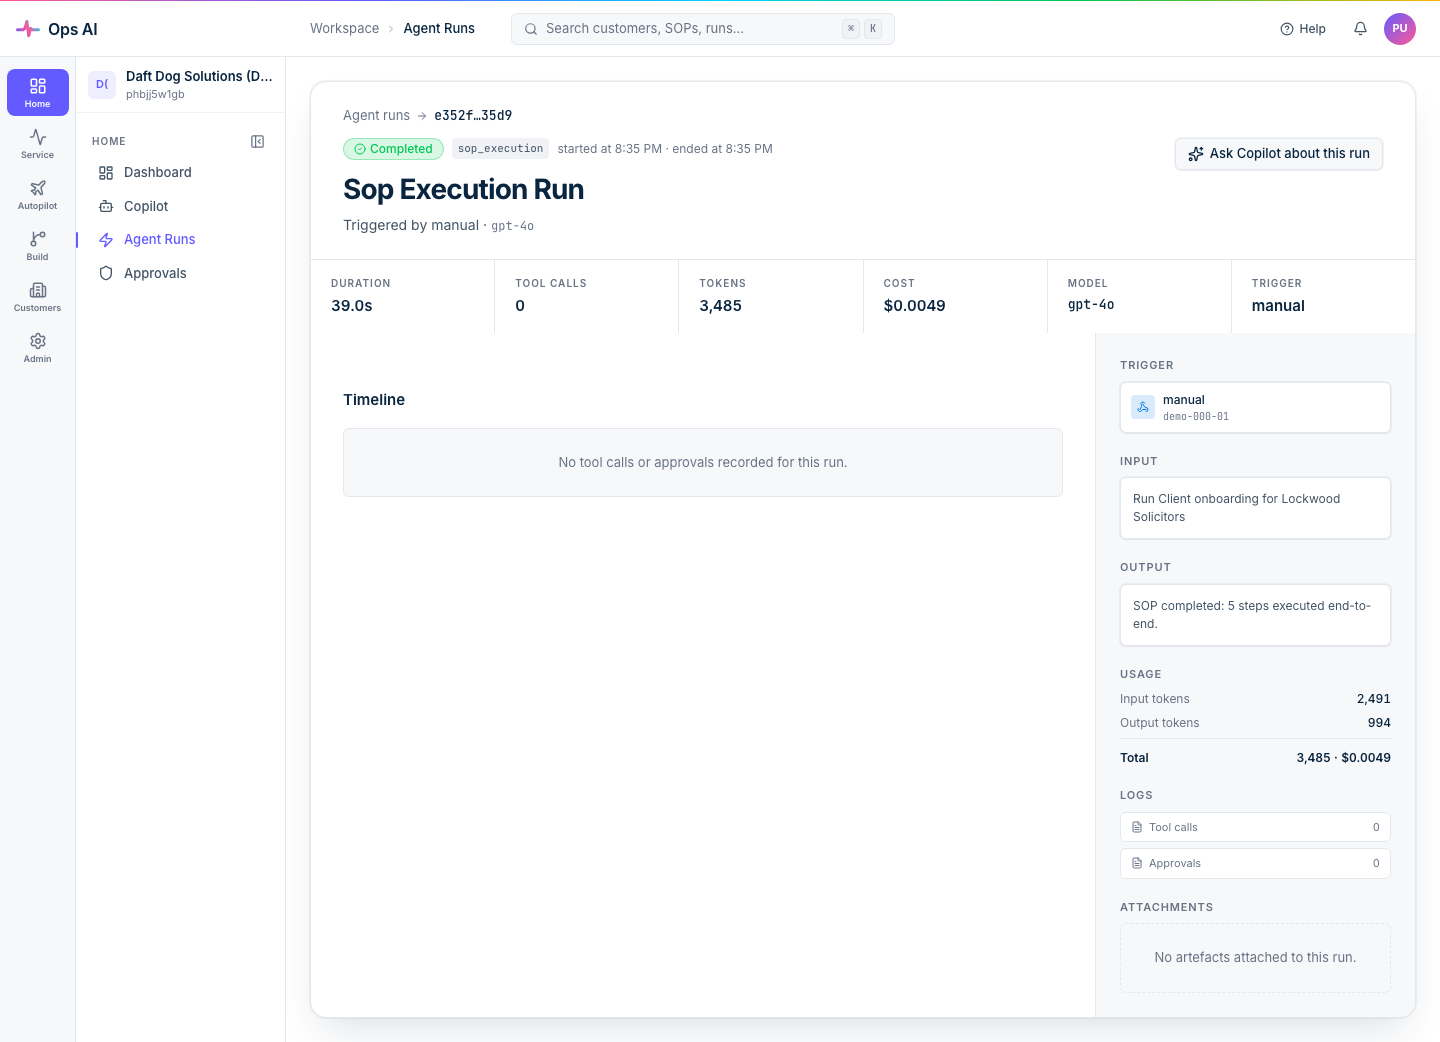
- Timeline — a chronological list of every tool call the agent made, with expandable sections showing input + output for each call.
- Approval Gates — points where the agent paused for human approval (if applicable), who approved, when, and any comment.
- Knowledge context — which Knowledge Base entries were retrieved into the agent's working set for this run.
- Metadata — token usage, estimated cost, duration, and correlation ID linking parent and child agent runs (e.g. a Triage run that chained into an SOP Execution run).
- Cost tracking — each run shows the estimated AI token cost so you can monitor spend in real time.
The detail page is the single best place to debug "why did the agent do X?" — the timeline preserves every tool input + output verbatim.
SOP Reports
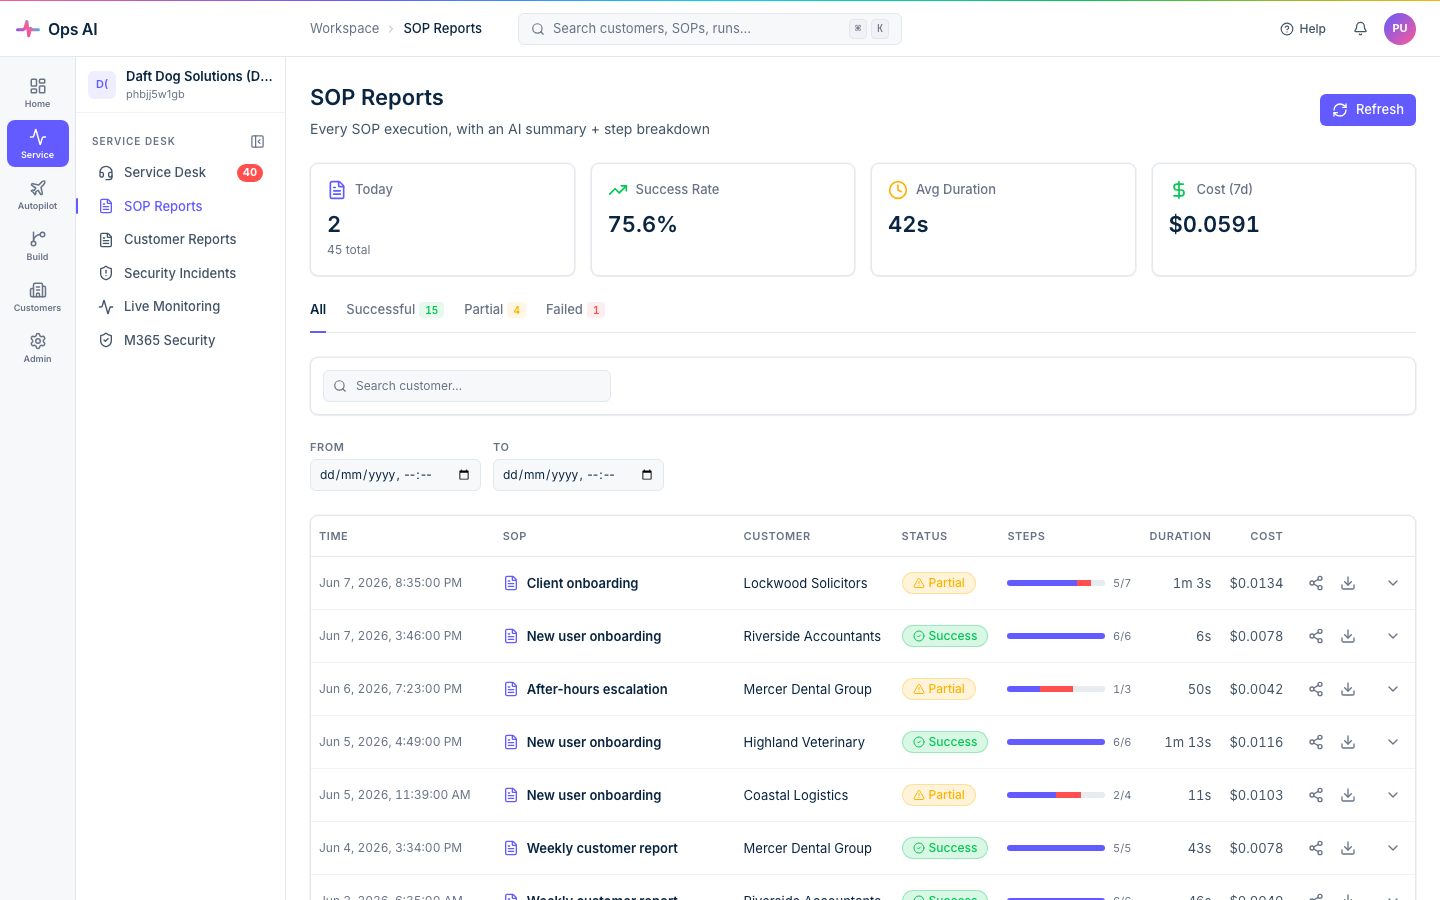
Open SOP Reports (/app/sop-reports) for completed-SOP-run reports. Each SOP completion produces a report with:
- Outcome — succeeded / failed / simulated (for Dry Runs).
- Customer — which customer the SOP ran against.
- Trigger context — what event kicked it off.
- Full transcript — every step, every tool call, every result.
- Cost — token usage + estimated dollar cost for the run.
- Public share link (optional) — a time-limited shareable URL you can send to a customer if they want to see the outcome of a procedure run on their behalf. The share link is read-only and works without an Ops AI account.
The share link uses an indistinguishable-410 pattern — once it expires, both expired and never-existed URLs return the same response, so the link can't be probed to learn whether a particular report exists.
A daily digest email ships every morning summarising the previous 24 hours of SOP outcomes; turn it on in Notifications under per-user preferences.
Customer Reports — chargeback rollups
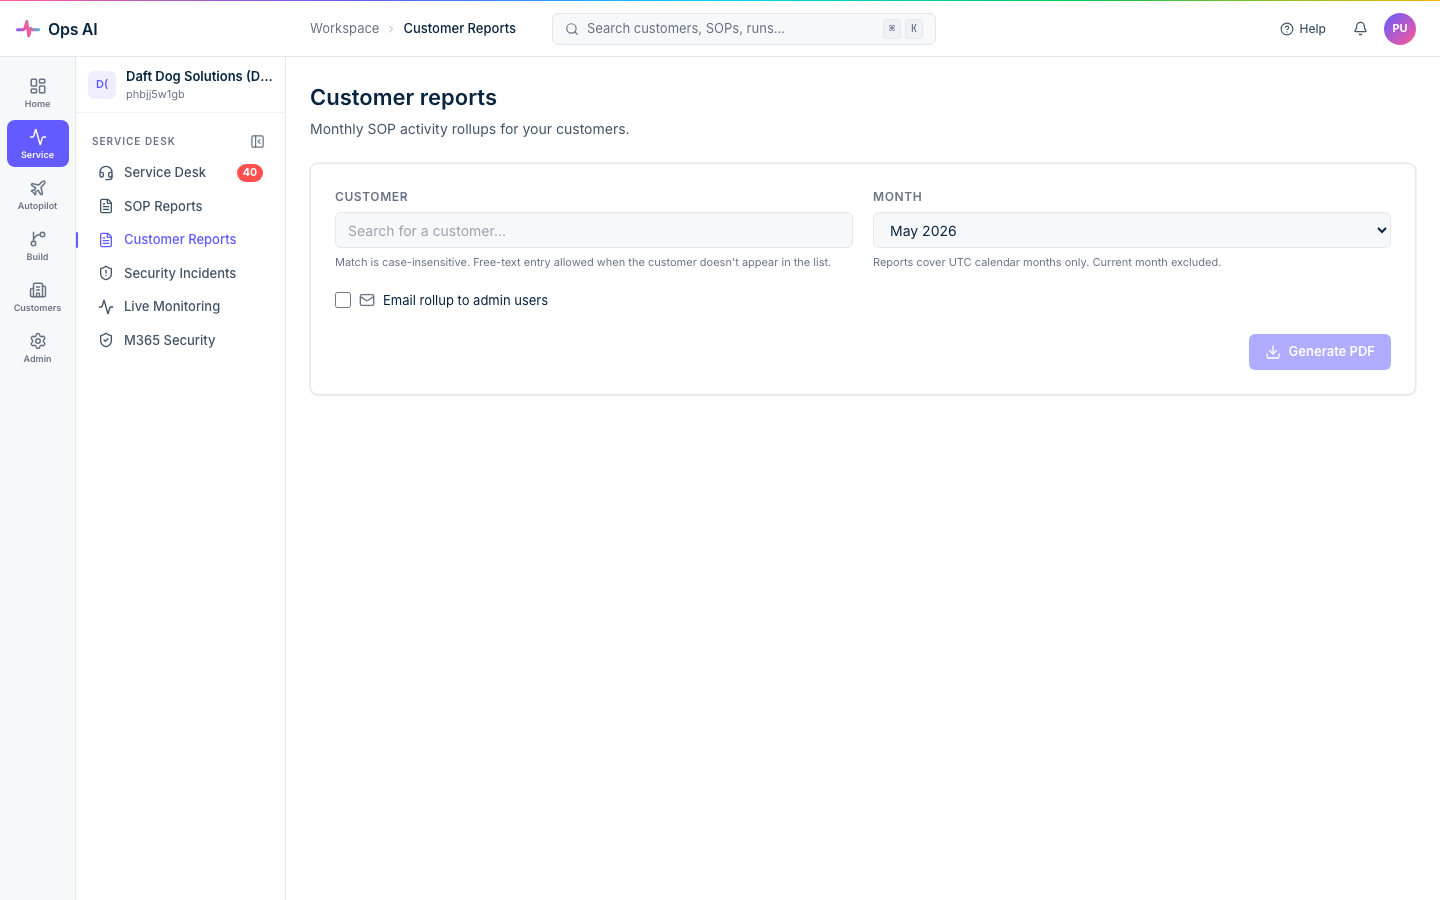
Open Customer Reports (/app/customer-reports) for per-customer cost rollups. Each customer row shows:
- Agent runs — count + cost for the period.
- Copilot turns — count + cost.
- Tool calls — total count.
- Total cost — for chargeback or markup.
Date-range picker at the top scopes the rollup. Monthly + daily aggregation jobs run automatically; the page reads the pre-aggregated data so it loads fast even on large MSPs.
Export options
- CSV — for accounting systems or your own pivot tables.
- PDF — for a customer-facing branded chargeback report (uses your Branding configuration).
- Public share link — same indistinguishable-410 pattern as SOP Reports. Send a customer their own monthly summary without giving them an account. The link is time-limited (default 30 days) and is rotatable from the row's menu.
Customer Analytics
Open Customer Analytics (/app/customer-analytics) for the per-customer trend view — same data as Customer Reports but rendered as time-series charts. Useful for "is Acme's spend trending up?" or "did the new SOP we shipped reduce manual ticket time on Acme?"
Click into any customer to open the Customer Analytics Detail page, which adds:
- Per-SOP usage — which of your SOPs run most often for this customer.
- Approval rate — what fraction of agent actions get approved vs rejected.
- Trend deltas — week-over-week and month-over-month changes.
Analytics — org-wide
Open Analytics (/app/analytics) for the high-level operational metrics dashboard. Summary cards at the top show today's count + 7-day trend for:
- Webhook Events received.
- Agent Runs triggered.
- Approvals decided.
- SOP Executions completed.
Each card shows a delta indicator (up / down vs the prior period). The daily metrics table below the cards breaks down day-by-day for the selected date range.
Reading the trends:
- Rising webhook events with flat agent runs — your routing rules may not be matching all incoming events. Review Routing Rules.
- High approval counts — consider switching some SOPs to Full Auto if you trust the automation.
- Declining SOP executions — check whether your trigger keywords still match the tickets coming in from your PSA.
The Dashboard also shows the same 7-day trend lines so you get the picture as soon as you sign in.
Where to look when something goes wrong
- Live Monitoring won't connect — hard-refresh the page; the WebSocket may have failed to upgrade. Persistent failure usually means a corporate proxy is blocking WebSockets — try a different network.
- Agent Run shows no transcript — the run probably crashed before anything was logged; the row's status will show
failed_pre_dispatch. Check Webhook Events for the upstream event. - SOP Report missing for a completed run — reports are written async with a retry. If a report is missing for more than ~5 minutes, contact Ops AI Support.
- Customer Reports show zero for a customer that's clearly active — the daily aggregation job may not have run yet for that customer. The page picks up the next aggregation cycle (within 24h) automatically.
- Public share link doesn't work — confirm the link hasn't expired. Rotated links replace any prior link for that report.