Dashboard tour
After signing in you land on the Dashboard (/app). It's the workspace overview: recent agent runs, integration status at a glance, pending approvals, and an agent-runs chart.

First-time admins also see a short guided product tour overlaying the surfaces below — skip anytime; replay it from the Help page (look for Replay product tour near the top).
Layout
- Left sidebar — groups everything into three sections:
- Operations — day-to-day work (Agent runs, Live monitoring, Approvals, Copilot, SOP reports).
- Configuration — setup that's done once (Integrations, SOPs, Routing rules, Webhooks, Knowledge base, Customers, Notifications).
- Admin — billing, users, audit log, scheduler.
- Topbar — global search (
⌘KorCtrl+K), notifications bell, Help link, and your account menu. - Main area — the active page; dashboard widgets when no specific page is selected.
A 5-minute first-run path
- Connect a PSA or RMM. Open Integrations in the sidebar, pick a vendor (Autotask, Datto RMM, Datto EDR, IT Glue, Pax8, or UniFi), and paste in API credentials. Click Test connection before saving — a green tick means we've successfully hit the vendor's API with the credentials you provided.
- Add your first customer. Once a PSA is connected, Customer Mapping (
/app/customer-mappings) discovers tenants from your PSA and lets you link them to Ops AI customer records. For Microsoft 365 customers, the CSP/GDAP wizard handles delegated-admin setup separately — see Customers. - Run your first SOP. Open SOPs (
/app/sops) and either clone an Ops AI-curated template or write a fresh procedure in the visual editor. Then run it against a customer from the SOP detail page. Live progress shows on Live monitoring (/app/live-monitoring). - Wire up notifications. Notifications (
/app/notifications) configures where agent completions, approvals, and failures get sent — Teams, email, or both.
Where to look when something goes wrong
- Agent runs not firing on incoming events? Check Webhooks for delivery + dedup status, then Routing rules for the matcher.
- An integration looks unhealthy? Integration Status (
/app/integrations/status) shows last-check timestamps and the most recent error message. - Need to see who did what? Audit Log (
/app/audit-log) captures every mutation — actor, action, resource, timestamp, JSON detail payload.
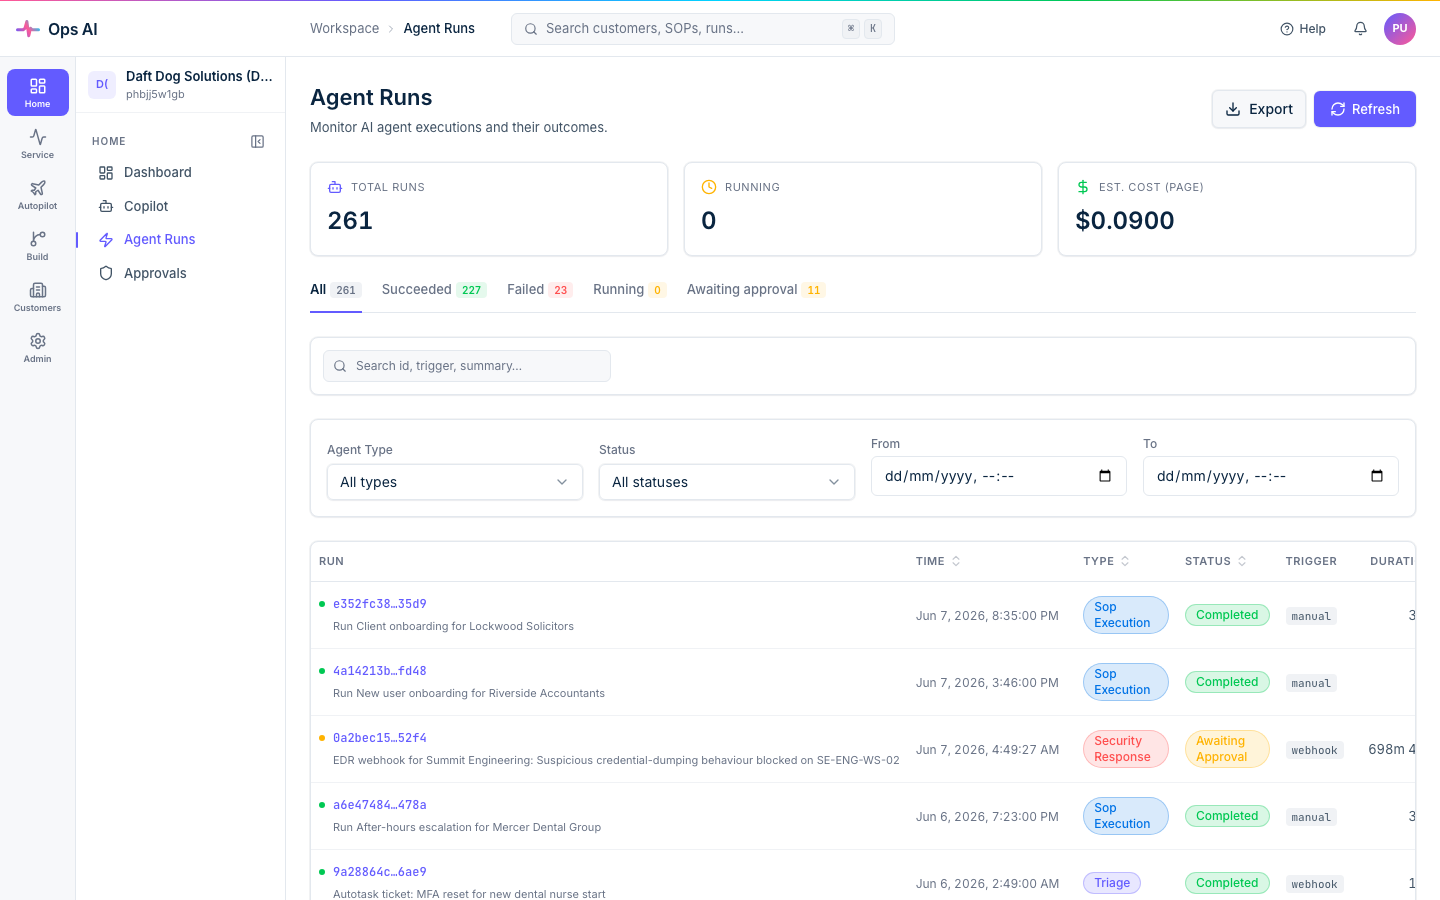
Agent runs at a glance
Every agent execution lives on Agent Runs (/app/agent-runs) with filters by type, status, and date. Each row shows the trigger summary, status, duration, tokens, and cost — click into one for the full timeline.
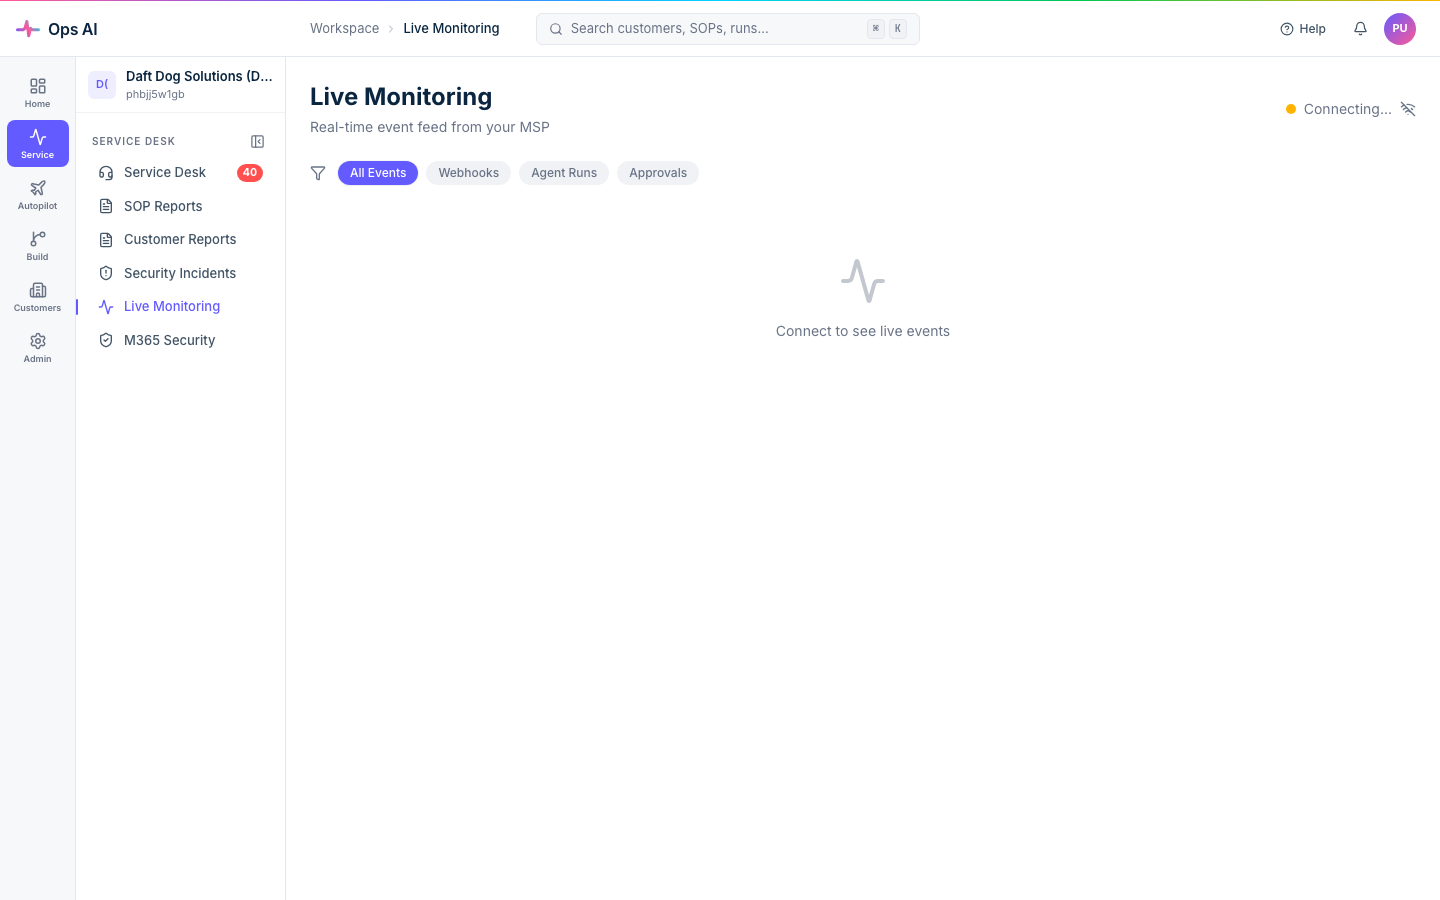
Live monitoring
For real-time visibility, Live Monitoring (/app/live-monitoring) streams webhook, agent run, and approval events as they happen via WebSocket. The green Connected indicator confirms the stream is live; filter by event type to focus on what matters.
The rest of this section walks each area in more detail.